1. What is pillow and why would you use it?
Pillow is a Python package for working with images. It is invaluable for working with image datasets, but personally I find its API rather hard to remember, so here I present a few of the most popular applications of pillow for machine learning.
A quick note on installation:
pip install pillow
2. Applications
a) displaying an image in a VSCode interactive session
IMHO VSCode provides the best environment for data scientists at the moment.
This one is fairly straightforward:
from PIL import Image
im = Image.open("image.jpg")
im
running simple im will display the image in the interactive session.
You can also run
im.show()
which will open up a separate window with your image in it.
When you’re done with looking at the image you should close it with:
im.close()
which resembles working with files, but for them you usually use context managers (with statements). So to be always sure the image is closed you can run
from IPython.display import display
from PIL import Image

with Image.open("image.jpg") as im:
    display(im)
but you have to specifically import display function, which will surely not be used in production.
b) drawing on an image
There are various shapes you can draw on an image, but the most commonly used are lines, rectangles, polygons and text.
from PIL import Image, ImageDraw, ImageColor
from IPython.display import display
with Image.open("image.jpg") as im:
    # check your image type (im.type) to see if it is RGB or black and white
    # if your image is in black and white, you will not be able to draw in color
    im = im.convert('RGB')
    draw = ImageDraw.Draw(im)  # a layer used for drawing
    coords = (0, 0, 100, 100) # (x1, y1, x2, y2)

    fill = ImageColor.getrgb("yellow")  # you can also provide rgb as e.g. #add8e6
    draw.line(coords, fill=fill, width=10)  # draw a line
    draw.rectangle(coords, fill=fill)  # draw a rectangle
    draw.rectangle(coords, outline=fill, width=4)  # draw a border of rectangle

    # polygon
    poly_coords = [(0, 0), (100, 100), (100, 200), (0, 100)]
    draw.polygon(poly_coords, fill=fill)

    # polygon border - you have to repeat the first coord
    draw.line(poly_coords + [poly_coords[0]], fill="black", width=10)  # draw a line

    # semi-transparent rectangle / polygon
    im = im.convert('RGBA')
    overlay = Image.new('RGBA', im.size)
    draw = ImageDraw.Draw(overlay)
    draw.rectangle(coords, fill=(0, 0, 0, 127))
    draw.polygon(poly_coords, fill=(200, 100, 0, 127))
    im = Image.alpha_composite(im, overlay)
    im = im.convert('RGB')  # re-conversion to RGB may be needed for saving as jpg

    # text
    draw = ImageDraw.Draw(im)  # resetting draw after semi-transparent rectangle
    draw.text((50, 50), "hello")
    display(im)
More about drawing you fill find in pillow docs.
c) heatmap
Heatmap is in many cases a visual representation of a matrix. The higher the values of the matrix, the brighter the color, but you can also use different scales, e.g. when presenting temperature data, cold may be in blue, hot in red, and average in white.
In case of pillow there is no dedicated function to draw heatmaps, as it is e.g. in matplotlib, but you can easily create one, which draws a separate point for each value of the matrix on an empty canvas.
First, let’s create a matrix. I will use a famous visual representation of Mandelbrot set, which is a fascinating mathematical, well, miracle.
If you want to dive deeper into things like Mandelbrot set, I highly recommend Chaos by James Gleick, which shortly explains how we can/should approach the fact, that 4 lines of simple code in Python can lead to infinite chaos and beauty.
import numpy as np


def define_frame(coords, resolution):
    re = np.linspace(coords[0][0], coords[0][1], resolution)
    im = np.linspace(coords[1][0] * 1j, coords[1][1] * 1j, resolution)
    x = re + im.reshape(1, -1).T
    return x


def mandelbrot(x):
    z = x ** 2 + x
    for _ in range(100):
        z = (z ** 2) + x
    return np.isnan(np.abs(z))


x = define_frame([(-2, 1), (-1.5, 1.5)], 1000)
man = mandelbrot(x)
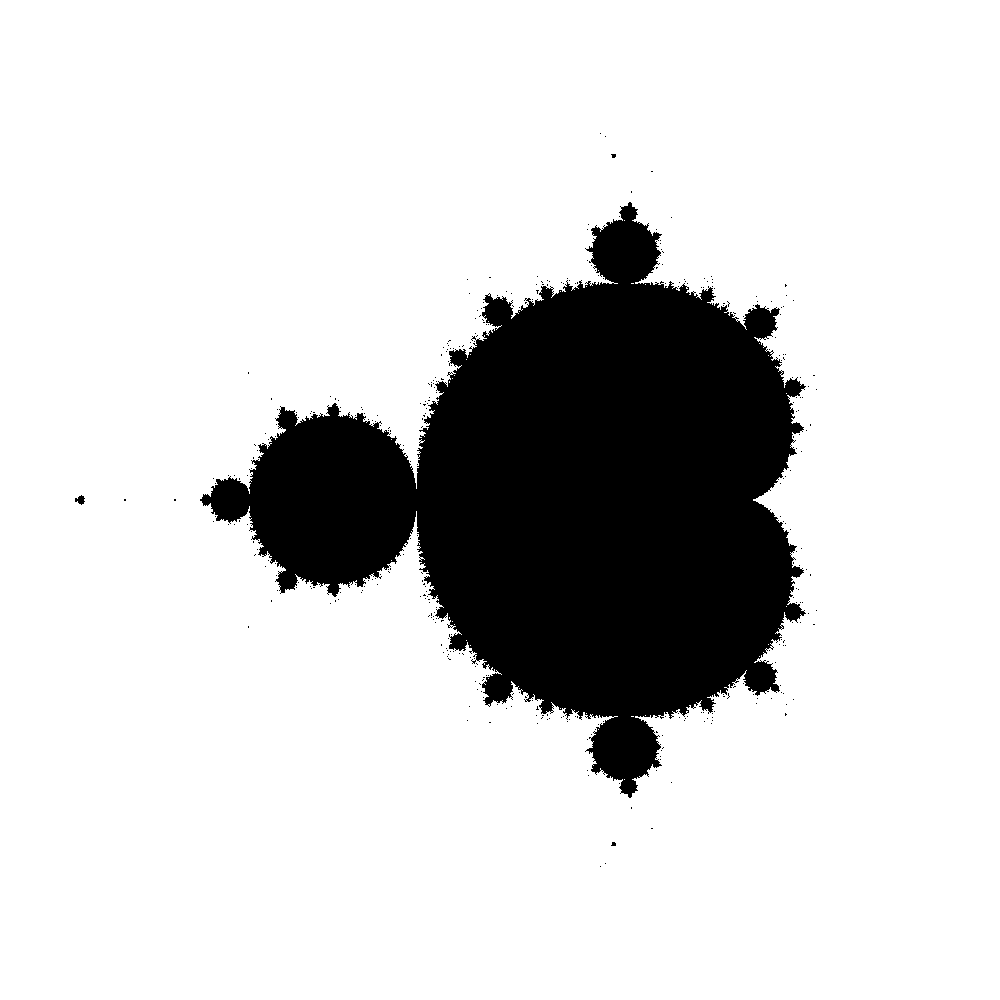
And the pillow plotting function (brighter colors represent higher values, except for zeroes, which are black):
from IPython.display import display
from PIL import Image, ImageDraw

with Image.new("RGB", man.shape, "black") as im:
    draw = ImageDraw.Draw(im)
    # draw point takes coords as a list of tuples
    points = list(map(tuple, np.array(np.where(man))[::-1].T))
    draw.point(points, fill="white")
    display(im)
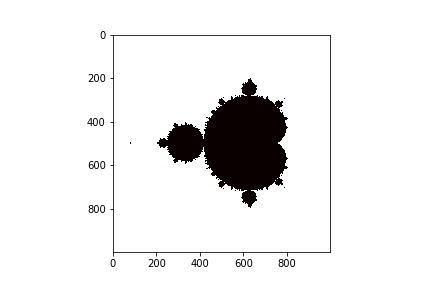
Of course you can also do this easily with matplotlib:
import matplotlib.pyplot as plt
plt.imshow(man, cmap="hot", interpolation="nearest")
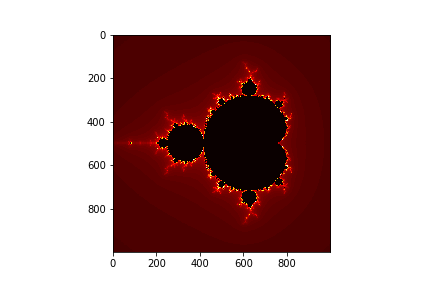
But we can go fancier with mandelbrot and add a parameter, which tells us… well, I’m not going to explain here how the Mandelbrot set is created (even though is is surprisingly simple. IMHO, this simplicity is the most disturbing), let’s just say that we add “temperature” to the plot.
def mandelbrot_color(x):
z = x ** 2 + x
scores = np.zeros(x.shape)
for n in range(100):
z = (z ** 2) + x
scores[(np.isnan(np.abs(z))) & (scores == 0)] = n
return scores
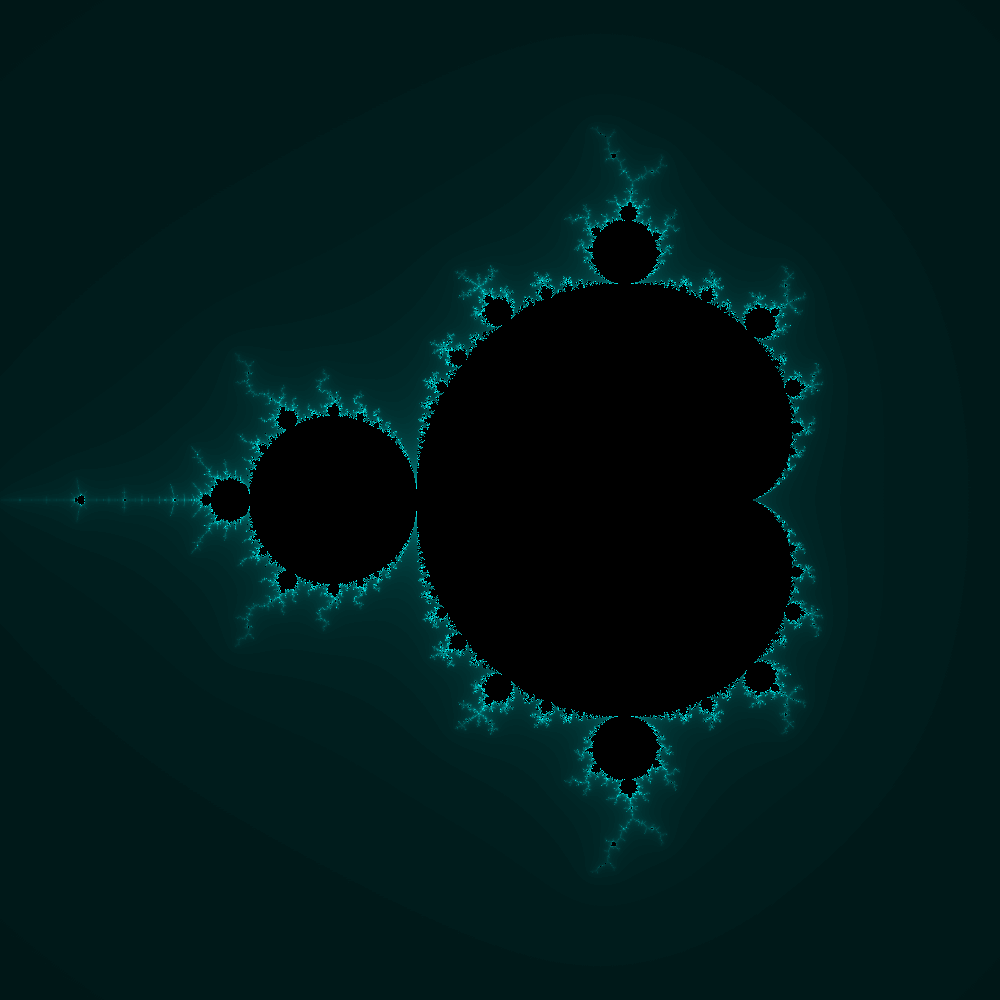
man_color = mandelbrot_color(x)
with Image.new("RGB", man_color.shape) as im:
draw = ImageDraw.Draw(im)
# draw point takes coords as a list of tuples
scale = np.max(man_color)
n = len(man_color)
for i in range(n):
for j in range(n):
c = int(man_color[i,j] / scale * 255)
# in RGB we give values to green and blue
draw.point((j, i), fill=(0, c, c))
display(im)
And one can do this with matplotlib as well:
import matplotlib.pyplot as plt
plt.imshow(man_color, cmap="hot", interpolation="nearest")